
Why Cost of Capital Matters
Every business, from a neighborhood coffee shop to a trillion-dollar tech giant, faces one unavoidable truth: money costs money. The way a company raises capital—whether by borrowing (debt) or selling ownership (equity)—has long-term consequences on profitability, control, and growth.
The central question entrepreneurs and executives wrestle with is:
👉 Which is cheaper: debt or equity?
At first glance, debt may look cheap because of predictable interest rates. Equity, on the other hand, doesn’t require monthly repayments but can dilute ownership and future profits. The reality is nuanced. The answer depends on context—interest rates, risk tolerance, tax policies, and even investor sentiment.
This article will break down the debate in simple, reader-friendly terms and explore the hidden costs of both debt and equity. By the end, you’ll have a clear framework for deciding which route is better for a given business situation.
What is Debt Financing?
Debt financing means borrowing money—usually from a bank, bondholders, or other lenders—with the agreement to repay it over time, typically with interest.
- Examples: Business loans, corporate bonds, credit lines, mortgages.
- Nature: Fixed obligation — interest must be paid, regardless of business profits.
- Impact on Ownership: None — lenders don’t gain control of the company.
Debt is often described as “leveraging” because companies use borrowed money to expand operations, buy equipment, or enter new markets, hoping profits will exceed the cost of interest.
What is Equity Financing?
Equity financing means raising money by selling ownership stakes in the company. This can be to angel investors, venture capitalists, private equity firms, or by issuing stock in public markets.
- Examples: Selling shares, venture capital, IPOs.
- Nature: No fixed repayment — investors earn returns through dividends or share value growth.
- Impact on Ownership: Dilution — new shareholders gain voting rights and a share of profits.
Equity is seen as a safety cushion because businesses don’t face the risk of default if profits slump. However, the trade-off is giving up part of the company’s future earnings and sometimes decision-making control.
Debt vs. Equity: The Initial Cost Comparison
Let’s simplify the cost comparison with a basic scenario:
- A company needs $1 million to expand.
- If borrowed as debt at 6% interest: Annual cost = $60,000 (interest).
- If raised via equity by selling 20% of ownership: Cost = 20% of all future profits.
At first, $60,000 looks much cheaper than giving away 20% of the company. But the story changes if the company becomes highly profitable—20% ownership could be worth millions later.
Table 1: Basic Comparison of Debt vs Equity
| Aspect | Debt Financing | Equity Financing |
|---|---|---|
| Repayment | Fixed interest + principal | No repayment obligation |
| Ownership | No dilution | Ownership diluted |
| Risk | Risk of default if profits fall | Lower risk — no mandatory payments |
| Cost Visibility | Predictable (interest rate known) | Variable (depends on future profits) |
| Tax Benefits | Interest often tax-deductible | Dividends not tax-deductible |
The Psychological Cost Factor
Numbers aside, cost isn’t just financial—it’s emotional and strategic.
- With debt, entrepreneurs sleep less if revenues dip because lenders still expect repayment.
- With equity, founders may resent sharing control, especially if investors push for decisions against the original vision.
This is why “cheaper” doesn’t always mean just monetary—it involves control, risk tolerance, and long-term vision.
Bar Graph: Cost Per $1M Raised (Illustrative Example)

(This simple graph shows debt looking cheaper in the short run, but we’ll later show how equity can become more costly or cheaper depending on business performance.)
The Deeper Costs of Debt
1. The Visible Cost: Interest Payments
When a company takes on debt, the first and most obvious cost is interest.
- Fixed-rate loans: predictable and stable, helpful for planning.
- Variable-rate loans: tied to benchmarks like LIBOR or SOFR, they fluctuate with market conditions, adding uncertainty.
Let’s imagine a business borrowing $1 million at 6%:
- Annual interest = $60,000.
- If revenues grow steadily, this cost looks manageable.
- If revenues dip, that $60,000 becomes a burden, eating into profits.
The visibility of debt cost makes it attractive to CFOs who like clear numbers, but this predictability hides deeper risks.
2. The Tax Shield: Why Debt Sometimes Looks Cheaper
One of debt’s biggest advantages is that interest payments are tax-deductible in the U.S.
Example:
- Company earns $500,000 profit before interest.
- Pays $60,000 in interest on debt.
- Taxable income drops to $440,000.
- If corporate tax rate = 25%, tax savings = $15,000.
This reduces the effective cost of debt from $60,000 to $45,000.
Table 2: Effect of Tax Shield on Debt Cost
| Item | Without Debt | With $1M Debt at 6% | Difference |
|---|---|---|---|
| Profit before interest | $500,000 | $500,000 | — |
| Interest expense | $0 | $60,000 | -$60,000 |
| Taxable income | $500,000 | $440,000 | -$60,000 |
| Taxes @ 25% | $125,000 | $110,000 | -$15,000 |
| Net profit after tax | $375,000 | $330,000 | -$45,000 |
👉 This shows how debt, after tax benefits, often looks cheaper than equity.
3. The Hidden Cost: Risk of Default
While tax shields help, debt carries a non-negotiable burden: interest and principal must be repaid, even if the business struggles.
- If revenues drop sharply, companies may default.
- Default leads to penalties, legal action, or bankruptcy.
- Credit ratings fall, making future borrowing more expensive.
For small businesses, even a single bad year can trigger a downward spiral if debt obligations are too high.
Bar Graph: Rising Debt Risk Over Time
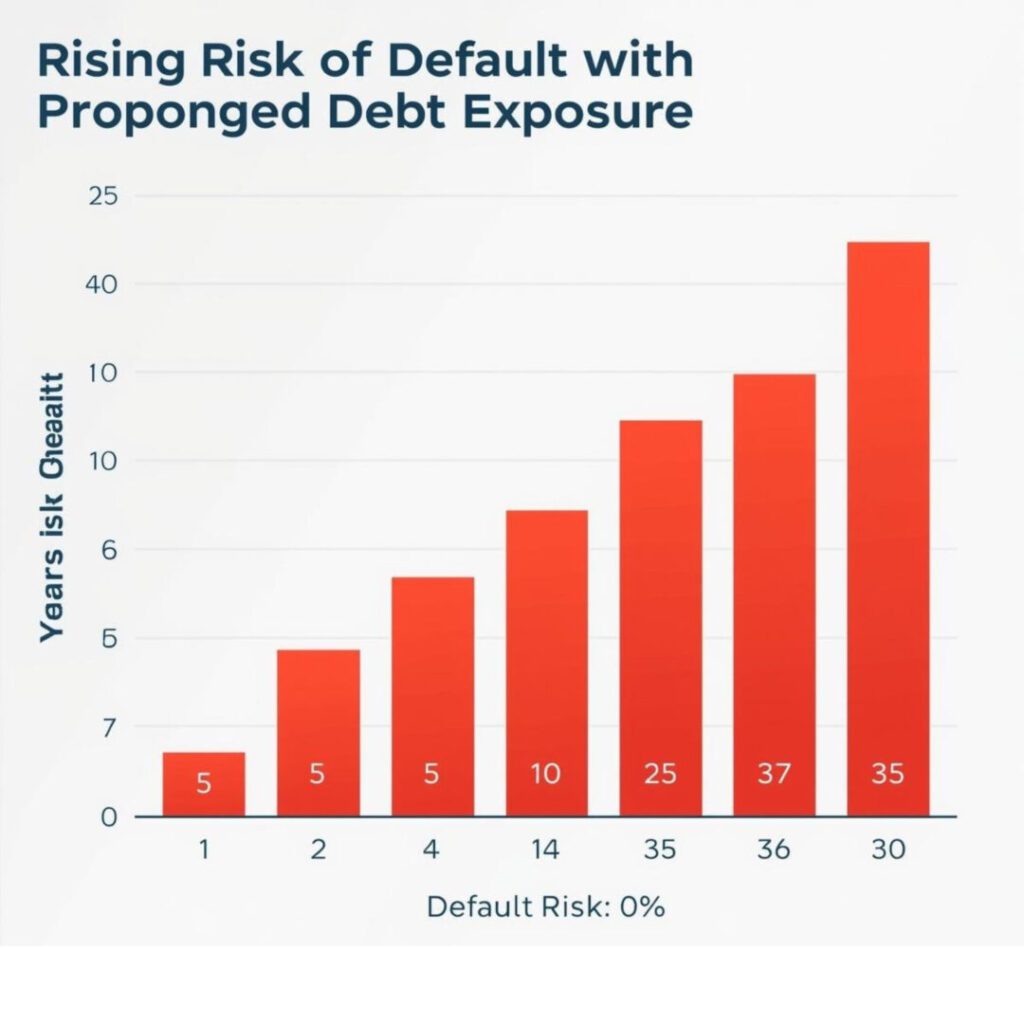
This shows how carrying debt for longer periods amplifies risk, even if initial costs look low.
4. Opportunity Cost of Debt
Debt also limits flexibility. When a large chunk of cash flow is tied up in repayments:
- Expansion projects may be delayed.
- Hiring new talent may become impossible.
- Innovation budgets shrink.
In other words, every $1 spent on debt repayment is $1 not invested in future growth. Over time, this lost opportunity may be costlier than the interest itself.
5. Psychological Pressure
Though often overlooked, debt creates mental and cultural pressure inside a business:
- Founders may feel chained to lenders.
- Management may prioritize short-term cash flow over long-term innovation.
- Employees sense financial stress, leading to reduced morale.
Equity investors share risk, but lenders don’t — they expect repayment regardless of whether the business thrives or struggles.
6. Case Example: Debt in a Startup vs. Established Company
Let’s consider two firms borrowing $1 million:
- Startup: Revenue unpredictable, risky cash flows. Default probability higher. Debt feels very expensive.
- Established company: Stable revenue, strong balance sheet. Debt is cheap thanks to low interest rates and predictable tax shields.
Table 3: Comparative Cost of Debt
| Factor | Startup | Established Company |
|---|---|---|
| Interest rate | 10% (higher risk) | 6% (lower risk) |
| Annual interest cost | $100,000 | $60,000 |
| Tax shield benefit | $25,000 | $15,000 |
| Net effective cost | $75,000 | $45,000 |
| Risk of default | High | Low |
👉 Clearly, the same $1M loan costs differently depending on the borrower’s profile.
7. When Debt Becomes Too Risky
Debt crosses into dangerous territory when:
- Debt-to-equity ratio becomes too high (over-leveraging).
- Cash flow is unstable.
- Interest rates rise significantly (as in inflationary times).
- The company faces disruptive industry changes.
In such cases, even “cheap” debt quickly turns into a costly mistake.
The True Cost of Equity
1. Why Equity Feels Cheaper at First
At first glance, equity seems appealing because:
- There are no mandatory repayments.
- Investors share the risk with the entrepreneur.
- Cash flow isn’t burdened by interest obligations.
For example, if a startup raises $1 million in equity from venture capitalists, there’s no $60,000 annual interest bill like in debt financing. Instead, investors wait for growth and a return later — usually through dividends or capital gains when the business grows.
2. The Ownership Dilution Effect
When a company issues equity, it is selling part of itself.
- Founders lose some control.
- Profits are shared with new shareholders.
- Decisions may need approval from external investors.
Example:
- A founder owns 100% of a company worth $2M.
- She raises $1M by selling 33% equity.
- Post-funding, the founder now owns 67%.
If the company later grows to $30M:
- The founder’s share = $20.1M.
- Investors’ share = $9.9M.
Had she borrowed $1M debt at 6%, she might have kept 100% ownership and paid only $60,000/year in interest.
👉 The long-term cost of equity is the future profits you give up.
3. Dividend Expectations and Payout Pressure
Equity investors typically expect returns of 10–20% or more, much higher than debt’s 5–8%.
- Public shareholders expect steady dividends.
- Venture capitalists want big exits (IPO or acquisition).
This raises pressure on businesses:
- To grow faster.
- To pursue strategies that maximize shareholder value (sometimes at odds with long-term stability).
Thus, while there’s no fixed repayment, there is performance pressure.
4. Comparing Cost of Capital: Debt vs Equity
One way to measure “cost” is through the Cost of Capital.
- Cost of Debt = Interest Rate × (1 – Tax Rate).
- Cost of Equity = Expected Return by Investors (often 10–20%).
Table 4: Typical Cost Comparison
| Financing Method | Nominal Rate | After-Tax Rate | Risk to Company | Investor Return Expected |
|---|---|---|---|---|
| Debt | 6–8% | 4.5–6% | Default risk | Interest payments only |
| Equity | 10–20%+ | N/A | Dilution, control loss | Dividends/Capital gains |
👉 Clearly, equity is often more expensive in terms of expected returns, even if cash flow feels lighter.
5. Bar Graph: Comparing Debt vs Equity Costs
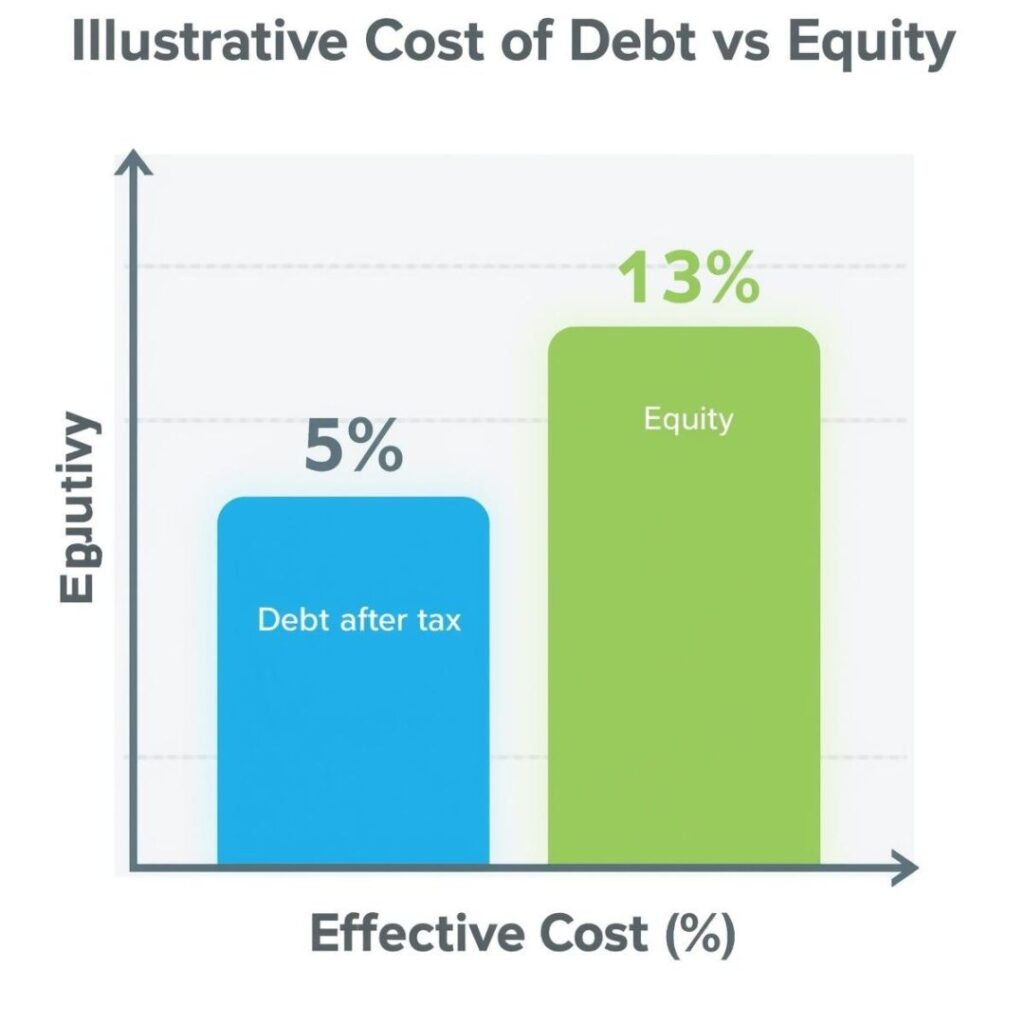
This visualization shows why, despite risks, debt often remains cheaper in pure financial terms.
6. Loss of Strategic Control
Equity investors don’t just want profits — they often want a say in how the business runs.
- Venture capitalists may demand board seats.
- Shareholders may vote on major policies.
- Pressure may rise to focus on short-term profit over long-term mission.
This can fundamentally change a company’s direction.
Example:
- A tech founder focused on building a sustainable platform may be forced by equity investors to “monetize aggressively” — even if it compromises the product vision.
Debt rarely imposes such control — as long as payments are made, lenders don’t interfere in strategy.
7. Equity and Future Fundraising
Another hidden cost of equity is its cumulative dilution.
- Each funding round dilutes earlier owners.
- Early mistakes in valuation lock founders into lower ownership.
If a founder sells 30% in the first round, another 20% in the second, and another 15% later, the founder may end up with less than 40% of the company.
The effective cost? Control slips away, and investors become dominant decision-makers.
8. Case Example: Startup Choosing Equity Over Debt
Imagine a startup raising $2M through equity instead of debt.
- They give up 40% ownership.
- In 10 years, company value = $50M.
- Investors’ share = $20M.
Had they borrowed $2M at 8% interest for 10 years:
- Total interest paid ≈ $1.6M (ignoring compounding).
- Founder would retain nearly $48.4M worth of equity.
👉 Equity, in this case, cost over 10x more than debt.
9. When Equity Still Makes Sense
Equity is not always worse — it shines in situations where:
- The business is too risky for debt lenders.
- Cash flow is unstable or unpredictable.
- Founders value shared risk over ownership.
- Strategic investors bring more than money (expertise, networks, partnerships).
For startups in early growth stages, equity may be the only viable funding option.
Direct Comparison — Which is Truly Cheaper?
1. The Illusion of “Cheapness”
At its core, the question of debt vs equity isn’t just about numbers. It’s about risk, control, and timing.
- Debt looks cheaper because its cost is fixed and often tax-deductible.
- Equity feels cheaper because it doesn’t require cash outflows in the short term.
But the “cheapest” choice depends on a company’s stage, cash flow, and growth potential.
2. Startups: The Equity-Heavy Stage
For startups, equity often dominates because:
- Cash flow is unstable.
- Banks rarely lend to unproven businesses.
- Risk-sharing is vital.
Example:
- A startup raises $500K debt at 10% = $50K annual interest. With little revenue, this is crushing.
- Raising $500K equity instead gives breathing room — but costs 25–40% ownership.
👉 For startups, equity is often “cheaper” in the short term because survival matters more than dilution.
3. SMEs (Small & Medium Enterprises): The Balancing Act
Once revenue stabilizes, debt becomes more attractive.
- Predictable cash flow means debt obligations are manageable.
- Tax shields reduce the net cost.
- Equity at this stage dilutes profits just as the company becomes profitable.
Table 5: SME Financing Trade-Offs
| Factor | Debt (6–10%) | Equity (20–30%) |
|---|---|---|
| Cash flow burden | High but predictable | None in short term |
| Ownership dilution | None | 20–40% typical |
| Risk | Default/bankruptcy | Investor pressure |
| Long-term cost | Lower (fixed interest) | Higher (profit sharing) |
👉 For SMEs, debt is often cheaper long-term, provided they can manage repayment discipline.
4. Large Corporations: Debt as a Strategic Tool
Big corporations often lean heavily on debt because:
- They enjoy lower interest rates due to strong credit ratings.
- They benefit most from the tax shield.
- They can diversify debt maturities (short vs long-term bonds).
Example: Apple, Microsoft, and Amazon have issued billions in corporate bonds despite holding cash reserves — because debt is cheaper than equity when tax benefits are considered.
👉 For large corporations, debt is almost always cheaper than equity.
5. Industry Context: Risk Shapes Cost
The “cheaper” option also depends on industry volatility:
- Stable industries (utilities, FMCG): Favor debt, since cash flows are predictable.
- High-risk industries (tech startups, biotech): Favor equity, since debt risk is too high.
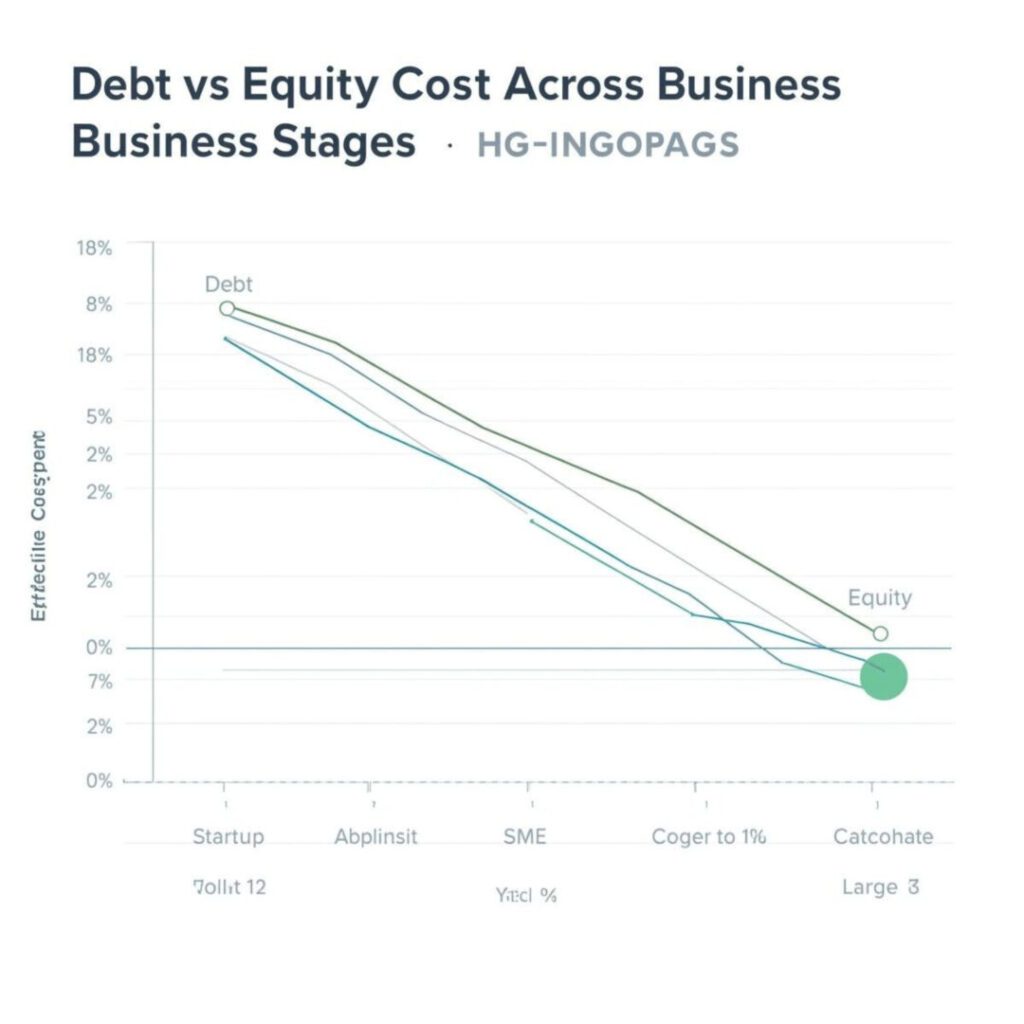
6. Graph: Cost Comparison Across Business Stages
This shows:
- Startups → equity looks cheaper (debt cost is too high).
- SMEs → debt overtakes equity as the cheaper option.
- Large corporations → debt is significantly cheaper.
7. Time Horizon: Short-Term vs Long-Term Cost
Debt and equity also differ based on time horizon.
- Short-term: Debt feels heavy (repayments start immediately).
- Long-term: Equity is heavier (ownership dilution compounds over years).
Table 6: Short vs Long-Term Costs
| Horizon | Debt | Equity |
|---|---|---|
| Short-term | Cash flow pressure | No repayment burden |
| Long-term | Fixed repayment ends | Diluted profits forever |
👉 Over 10–20 years, equity often costs much more than debt.
8. Economic Environment: Interest Rates Matter
When interest rates are low (like in 2020–2021):
- Debt is extremely cheap.
- Companies rush to issue bonds.
When interest rates are high (like 2023–2024):
- Debt becomes risky.
- Equity might look more attractive despite dilution.
9. Weighted Average Cost of Capital (WACC)
Businesses often calculate the Weighted Average Cost of Capital (WACC) to find the “cheapest mix” of debt and equity.
- WACC blends debt’s tax-adjusted cost and equity’s expected return.
- The goal: minimize WACC to maximize company value.
This explains why companies rarely rely on 100% debt or 100% equity — the cheapest path is usually a balance.
Hybrid Approaches — Blending Debt and Equity
1. Why Hybrids Exist
Debt and equity each carry trade-offs:
- Debt = cheaper but risky if cash flow falters.
- Equity = safer on cash flow but costly in ownership dilution.
Enter hybrid financing, which blends features of both. Hybrids allow businesses to:
- Lower overall financing costs.
- Share risk more evenly.
- Retain some control while still raising capital.
2. Convertible Debt
What It Is
Convertible debt starts as a loan but can later convert into equity under certain conditions.
- Early-stage startups often use convertible notes.
- Investors accept interest + the option to convert into shares later at a discount.
Example
- A startup raises $1M via convertible notes.
- Investor earns 6% interest annually.
- After 3 years, if the company raises Series A, the note converts into equity at a 20% discount.
Benefits
- Founder delays dilution.
- Investor gains upside if the company grows.
👉 It’s “cheaper” for startups than equity upfront and less risky for investors than pure debt.
3. Preferred Equity
What It Is
Preferred equity sits between common equity and debt.
- Investors get priority dividends (like debt interest).
- But they also share in upside growth (like equity).
Table 7: Preferred Equity vs Common Equity
| Feature | Preferred Equity | Common Equity |
|---|---|---|
| Dividend Priority | Higher, fixed | Last in line |
| Voting Rights | Usually limited | Full voting rights |
| Risk | Lower | Higher |
| Return Expectation | Moderate (8–12%) | Higher (15–20%+) |
👉 Preferred equity is cheaper than common equity in return expectations, but costlier than debt.
4. Mezzanine Financing
What It Is
Mezzanine financing is a blend of debt and equity, often used in expansion-stage companies.
- It acts like debt but can convert into equity if repayment fails.
- Typically used in buyouts, acquisitions, or aggressive expansion.
Example
- Company raises $5M mezzanine financing at 10% interest.
- If company can’t pay, lender takes equity shares instead.
👉 For companies, it’s flexible but expensive — often more costly than pure debt but cheaper than pure equity in large deals.
5. Warrants and Equity Kickers
Some debt comes with warrants (options to buy equity later).
- This lowers the interest rate (since investors get equity upside).
- Example: Investor accepts 5% loan interest instead of 8%, but gets the right to buy shares at today’s price in the future.
👉 This makes debt cheaper upfront but introduces partial dilution later.
6. Case Comparison: Pure vs Hybrid Financing
Let’s compare a company raising $2M three different ways.
Table 8: Pure vs Hybrid Financing
| Option | Cost to Company | Ownership Dilution | Risk of Default |
|---|---|---|---|
| Pure Debt (8%) | $160,000 annual interest | None | High |
| Pure Equity (30%) | $600K–$1M long-term profit share | 30% dilution | None |
| Convertible Debt (6%) | $120,000 interest + later equity dilution | 10–20% dilution | Medium |
👉 Hybrid options strike a middle ground — often cheaper than equity and safer than debt.
7. Graph: Relative Cost of Financing Methods
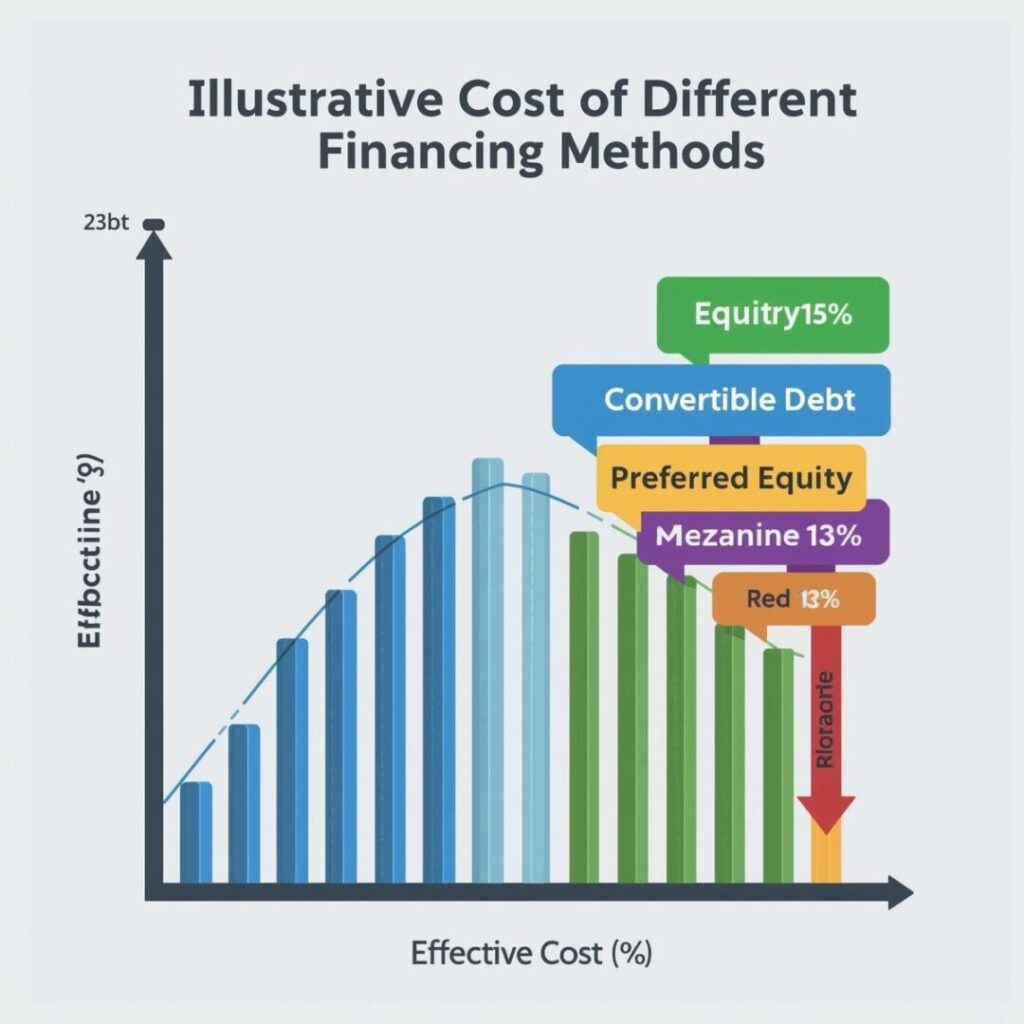
This chart highlights how hybrids cluster between debt and equity in cost.
8. When Hybrids Are Cheaper
Hybrid financing is often cheaper in these scenarios:
- Startups: Convertible debt avoids heavy early dilution.
- SMEs: Preferred equity attracts investors without full ownership loss.
- Acquisitions: Mezzanine financing funds big deals without overloading debt.
9. When Hybrids Are Expensive
Hybrids can backfire if:
- Terms are too investor-friendly (excessive dilution later).
- The company over-relies on “complex” instruments instead of straightforward debt or equity.
- Market conditions change (higher valuations make early equity-linked deals costly).